If you're a seller looking at marketplaces to bolster revenue, Amazon is the king. Their third-party marketplace generated an estimated $575 billion in global GMV in 2025. The platform isn't just surviving; it's accelerating. At the same time, their latest set of results tell us that seller numbers are dropping. If you go hard at Amazon, you can't fail right? Well the numbers tell a different story
Here's a number that should make you stop scrolling: Amazon's global GMV surpassed $830 billion in 2025 — up 9% year on year, and more than three times what it was seven years ago. Third-party sellers now represent 69% of total Amazon GMV, up from 60% in 2019. The marketplace's share of the pie keeps growing.
And yet, the seller story is more complicated. Amazon seller numbers have declined from 2.4 million in 2021 to 1.65 million on 2025. That's a drop of 31% in 4 years. The UK accounts for approximately 9.5% of Amazon's global seller base, meaning around 281,000 UK sellers — and that number too has been contracting. Marketplace Pulse data shows that the top 1.6% of sellers drive 50% of Amazon's third-party GMV, which tells you something important about the opportunity distribution on the platform.
Sources: Marketplace Pulse (Jan 2026); GoFBAHub / Forceget Amazon Seller Statistics (2025); Amazon Q4 2025 results; Capital One Shopping Research (2025)
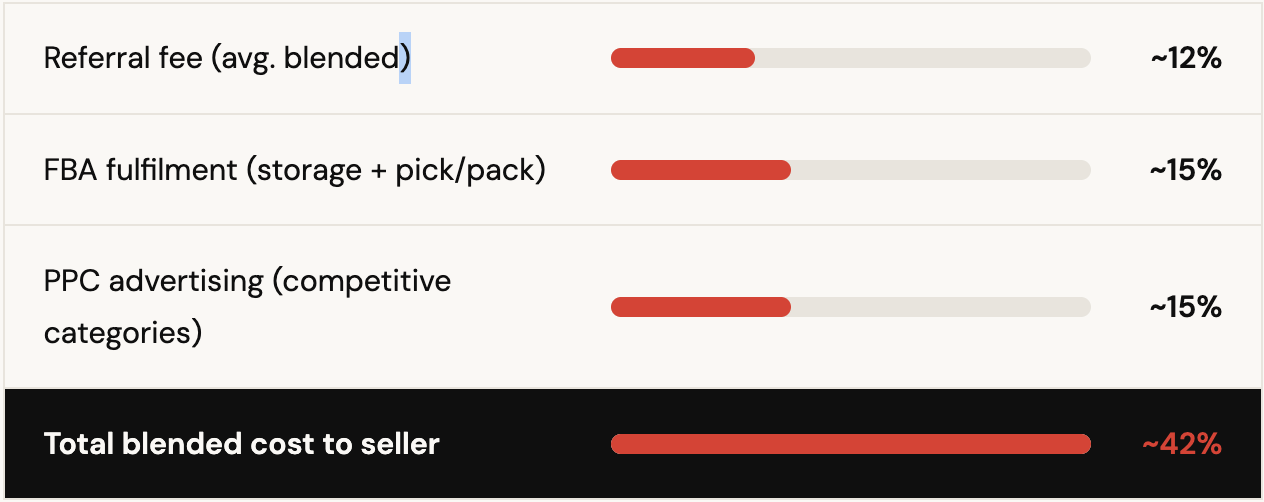
Sellers, attracted by Amazon's headline referral fee of 8–15%, assume that's the story. It isn't. Just listing rarely brings the desired level of sales - Amazon is so competitive that sellers soon realise that they should be spending on advertising to drive traffic, and FBA to get the Prime badge, and Vine to encourage reviews - so what started as a 15% cost of sale quickly becomes a 40% calculation.
Amazon's advertising revenue hit $56.2 billion in 2025, up from $46.9 billion the prior year. Someone is paying for all that — and it's sellers. Around 61% of Amazon sellers run PPC campaigns; in competitive categories, it's closer to 100%.
The blended commission a seller should expect to pay is closer to 40%.
Source: Amazon fee schedules (2025); Jungle Scout State of the Amazon Seller 2025; industry benchmarks. These are estimates for a typical mid-size seller using FBA in competitive general merchandise categories. Exact figures vary by product, category and advertising strategy. Agency/management fees, software subscriptions and VAT are not included.
That's before you add agency fees, account management tools, software subscriptions, or the salary of whoever is managing the account. For many sellers, the real all-in cost is closer to 50% of revenue. On a 30–40% gross margin product, that doesn't work.
The most common reactions when faced with underwhelming Amazon sales is to invest more in the channel or to shut the whole thing down. But the best option is to diversify across other marketplaces.
Marketplaces have exploded in popularity and now everyone's got one. If you sell clothing, as well as Amazon, you could be looking at ASOS, Boohoo, Brand Alley, Debenhams, Ebay, Freemans, John Lewis, Littlewoods, M&S, Next, Secret Sales, Shein, Temu and many more (sorry if I missed you off the list). According to the ECDB, marketplace sales will account for 87% of all e-commerce spend in 2026. That's nearly 9 out of every £10 spent!
Rather than just saying "diversify," let's look at the actual numbers. We've pulled together the best available 2025 data on the top 10 UK marketplaces and built a comparison based on monthly UK traffic, estimated active sellers, estimated GMV, and — critically — estimated GMV per seller per month. This last figure is the one that matters: it tells you how big the pie is relative to how many people are sharing it.
Where figures are estimates (most GMV and seller count numbers are, given how secretive most platforms are), we've flagged them clearly. All data is from 2025 sources unless otherwise stated.
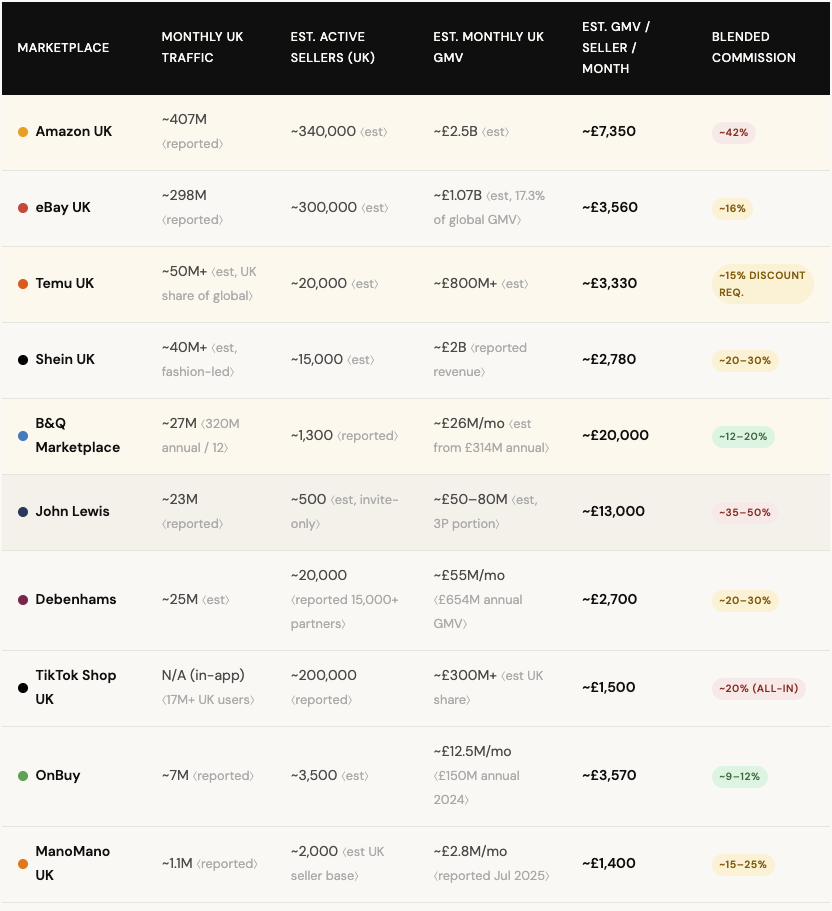
All GMV-per-seller figures are estimates. See footnotes for full sources and methodology. Monthly GMV figures are estimates derived from reported annual figures or proportional calculations.
So, when you work out the revenue per seller and subtract fees, here's a league table from highest to lowest
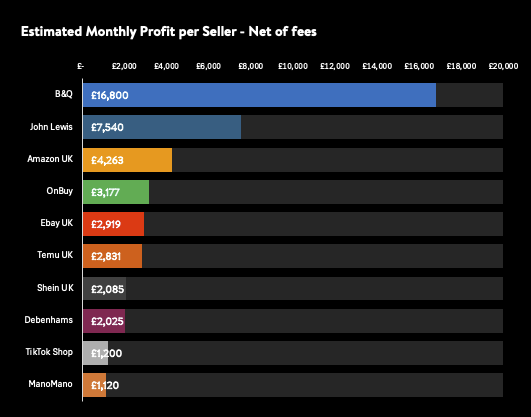
Here we can see that Amazon sits towards the top in spite of their high take rate. But, look what happens when you factor in COGS at 50%:
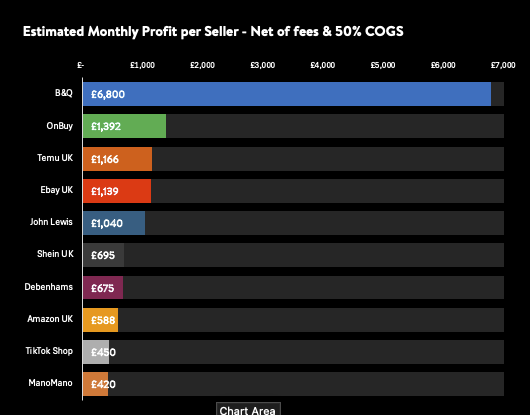
Amazon's down to 8th. That higher take rate is the killer. In fairness, the bigger your margin the better Amazon looks: if you have a 75 point margin Amazon comes in third.
Sources: Kingfisher FY25 results / ChannelX (Nov 2025) for B&Q; ChannelEngine (2025) for John Lewis and Amazon; Marketplace Pulse (Oct/Jan 2026) for Amazon global ranking and GMV; GoFBAHub/Forceget (2025) for UK seller count; eBay Q3 2025 earnings / Yaguara (2025) for eBay; Intelligent CIO / ChannelX for OnBuy; Debenhams Group FY25 results / TheIndustry.fashion (Nov 2025) for Debenhams; Red Stag Fulfillment (Jan 2026) / TikTok newsroom (Nov 2025) / phtimesfashion.cn (Jan 2026) for TikTok Shop; Grips Intelligence (Jul 2025) / Sacra (2025) for ManoMano; industry estimates for Temu and Shein.
Truth be told, I wouldn't use this methodology to try to predict sales on a given channel - there are simply too many variables for that - but, if you want to play the odds, spread-betting looks like a better option than putting everything on Amazon.
Something else to think about - you need roughly one sixth the sales volume on 10 channels than you do on Amazon: if you sum the average net net revenues of all ten marketplaces, you get a total of £14,365 net of fees and net of COGS. I know there are a number of businesses doing that kind of business on Amazon alone but they'd need to be generating over £350,000 worth of sales to do it. If you spread your activity across 10 channels, you need a sixth of the sales (£59,190) to generate the same profit!
The point isn't that Amazon is bad — it's that using more money to fix an Amazon problem is rarely the answer. 42% of Amazon sellers make £1,000 or less per month, according to Capital One Shopping research. A single algorithm change, a suspended listing, or a shift in Buy Box dynamics can wipe out months of sales overnight. Sellers with genuine multi-channel presence sleep better — because no single platform has the power to turn off their entire business.
"The money you're pouring into Amazon PPC isn't fixing a performance problem. It's paying to stay still on a treadmill that keeps getting faster."
The table and charts give you the maths. But a smart marketplace strategy involves a few other factors that don't fit in a spreadsheet.
Brand fit matters more than traffic. Selling on eBay if you're a premium brand can feel like parking a Porsche on a market stall. Conversely, listing on John Lewis or B&Q gives your products an instant credibility boost — one that can lift your brand perception everywhere, including your own website. Think carefully about where your products belong, not just where the traffic is. Temu and Shein in particular carry a price-led, volume-first reputation that simply doesn't suit every seller.
Ceiling potential isn't equal. Amazon is the biggest room and has the highest ceiling — 407 million monthly visitors and a global fulfilment infrastructure that no other platform can match. But it's also the most crowded, the most costly, and carries the most algorithm risk. B&Q and John Lewis have smaller ceilings but far less competition, stronger buyer intent, and more favourable margin dynamics. Newer platforms like TikTok Shop and OnBuy offer genuine first-mover runway — the sellers who establish themselves now, before the crowd arrives, will have a significant structural advantage.
Access isn't always open. John Lewis is invite-only and highly selective — they want proven brands with strong reviews and margin headroom to absorb their fees. B&Q vets sellers carefully and now welcomes European vendors, but it's a genuine application process. OnBuy requires a minimum feedback score of 90% with at least 50 reviews. Shein skews heavily toward fashion. Some doors take time to open — factor this into your 12-month planning horizon.
On paper at least, selling on multiple channels looks like a better approach than doubling down on Amazon. Going on average net profits it looks six times better in fact.
You may feel that managing lots of channels sounds like the type of headache you could do without. Keeping track of all those orders from all those channels. Doesn't sound practical.
Well, orders aren't your problem: listings are.
Pretty much any tier one listing platform (by that I mean stand-alone software built with the purpose of integrating marketplaces) can handle the order flow and push them into your existing tech stack with ease. Not many can fully automate the listings process so that your data is sent in the speficied format so that listings are created automatically.
If you can crack that, you're off to the races.
Marketplaces account for 86% of all e-commerce sales. We automate the data conversion so you don't have a mountain to climb before you can launch each channel.
 Dan Burnham